
When trying to understand the potential future price growth of an instrument, there are a variety of ways to do that, depending on the asset class. When looking at a commodity, like oil, analysts tend to reference the supply and demand. How much is being consumed, against how much is being made.
Q1 2021 hedge fund letters, conferences and more
Supply and demand for Bitcoin works slightly differently, because there is a limited cap on the amount of supply, eg. 21,000,000. Demand for BTC can be seen especially now, with many financial institutions jumping on the crypto bandwagon, and the availability to use BTC in wider circles, for instance even for buying a vehicle at Tesla.
Bitcoin SV is descended from the original Bitcoin technology, but with a goal of being much more usable as a currency for day to day transactions.
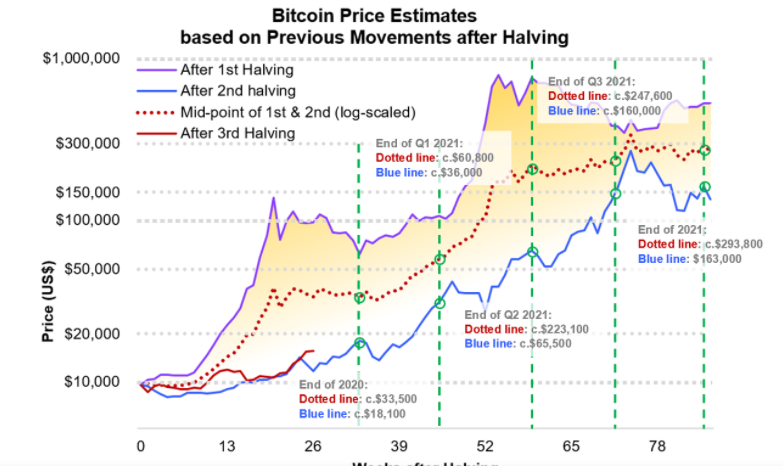
Other events that can impact Bitcoin’s price are halvening (halving) events. This is where miners who effectively use their computing power to solve riddles, get rewarded with BTC when they are successful. Halevnings take place approximately every four years, and as you can see from the chart, they have a powerful effect on the price. Miners don’t like them as they receive half the amount of BTC following each halvening event, for the same amount of work as before.
Perhaps another driver of price when it comes to BTC are fundamental events such as news, for instance politicians talking up cryptos (or talking them down), or even unquantifiable news, such as the financial banking system dramatically underperforming.
Technical Studies for Forecasting BTC Price
Technical analysts tend to look at how overbought or oversold the asset is and whether the price is about to make a reversal by incorporating technical indicators like the popular RSI or the SMA on charts of different time frames.
But one strong indication of the potential growth of Bitcoin is to look at its cycles, what has moved the price in the past, and to watch out for these events in the future, as technical analysts who look at charts all day know, history always repeats itself.
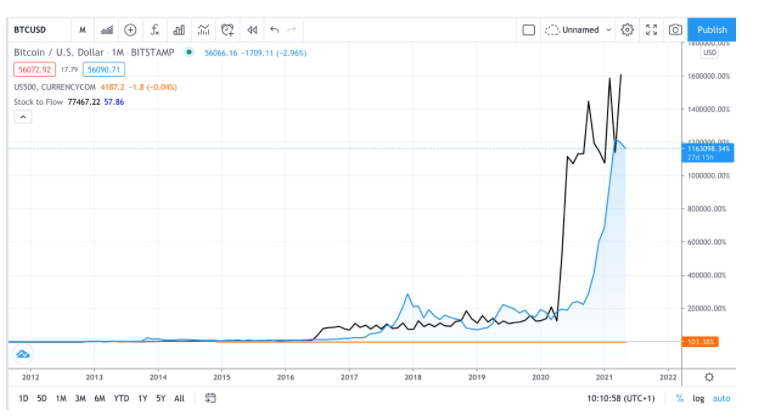
One powerful indicator to look at with reference to Bitcoin’s price is the Stock-to-Flow ratio, which can be incorporated directly onto the chart. It is often used for commodities, but it has been successfully used to predict Bitcoin’s astonishing rise. It looks at how much of the asset is currently available (the stock) eg. now in circulation, versus the amount being created (the flow).
This works on a supply and demand basis. It makes sense that each Bitcoin Halving event would impact this ratio, as every time this event takes place (after approximately 210,000 Bitcoins created by miners) the amount of BTC generated becomes halved. Thus when supply drops, demand is higher against the available supply or stock.
While the aforementioned news drivers do impact the price, eg. Elon Musk tweeting, the price tends to correct itself in the short term. The real long term driver is the supply and demand i.e. the Stock to flow ratio. If you overlay this model onto an all time price chart (see below), you can see how spot on the ratio was historically at tracking the price, and going forward you can see the price should make it to the $160k price level.
Notable milestones that have affected Bitcoin’s price:
In 2013, people were in shock that the price had climbed from $1 to $1000 in a few short years. This coincided with NXT by Jelurida, the first to implement a pure proof-of-stake consensus protocol. It was both reliable and energy efficient, and required minimal hardware. The proof-of-stake algorithm coined by NXT has stood the test of time, with no successful attacks since it launched.
2017 was a huge year for BTC and for the crypto industry at large, with hundreds of new coin offerings through ICOs. This was the go-to investing tool at that time for the industry. While many coins failed to gain traction, TRON broke the records for a truly successful ICO with a new approach to the blockchain, and a company that is still very much alive and kicking today. USDT, a popular currency used on TRON, at time of writing has now passed a market cap of over $50 billion and supply has outstripped Ethereum.
If 2017 was the year of the ICO, then 2021 is very much the year of DeFi. As more and more decentralized financial projects launch, the focus lies now on the real utility of coins and the quality and real world use of the projects behind them. One of the main challenges in this area is the amount of liquidity available in this marketplace. More projects like Orbs are focusing on harnessing the liquidity available to make secondary blockchains interoperable and fluid enough to function well in the crypto trading arena.
As things heat up in the crypto space, and more banks, enterprises and governments move forwards to incorporate crypto into their plans, this will all help the price of BTC and other cryptos to climb higher. The Stock to Flow ratio as demonstrated earlier is an excellent way to track this growth and to understand the future potential even if you are not a technical analyst.